
Abandoned cart discounts
 by Chad Zollinger Founding Marketer
Published
Abandoned cart discounts: when 5% beats 30%
Bigger abandoned cart discounts can lift conversions but reduce contribution. See a 5% vs 30% example and learn how to test your own offers.


TL;DR
In case you're sick of reading walls of text, we prepped a slide deck that should give you the gist of this article.
Shoppable & interactive emails that convert
Book a demoMy being newer to the world of ecommerce does not excuse the assumption that I may or may not have fallen victim to: a 30% discount should perform better than a 5% discount, right?
In a superficial way, it did perform better in a recent test.. conversion rates were way higher at 30% discount. But just how much are you giving up by offering such a heavy discount?
In a chart shared on linkedin by Zaymo co-founder Daniel Jones, a 5% offer showed $3.09 in contribution per shopper against $2.13 at 30% off… about 45% more. The bigger discount had the higher conversion rate; the smaller one kept more contribution per shopper. This is one test, not a universal rule, but it’s a clean example of why the offer that converts best often isn’t the one that earns the most.
Below: what the test showed, why it happens, and how to run the same comparison on your own flow.
What the abandoned cart test showed
The data comes from an abandoned-cart test Daniel Jones shared on LinkedIn: one large direct-to-consumer brand ran seven versions of the same offer, one at each 5% step from 0% to 30%, against a stated starting contribution margin of about 40%.
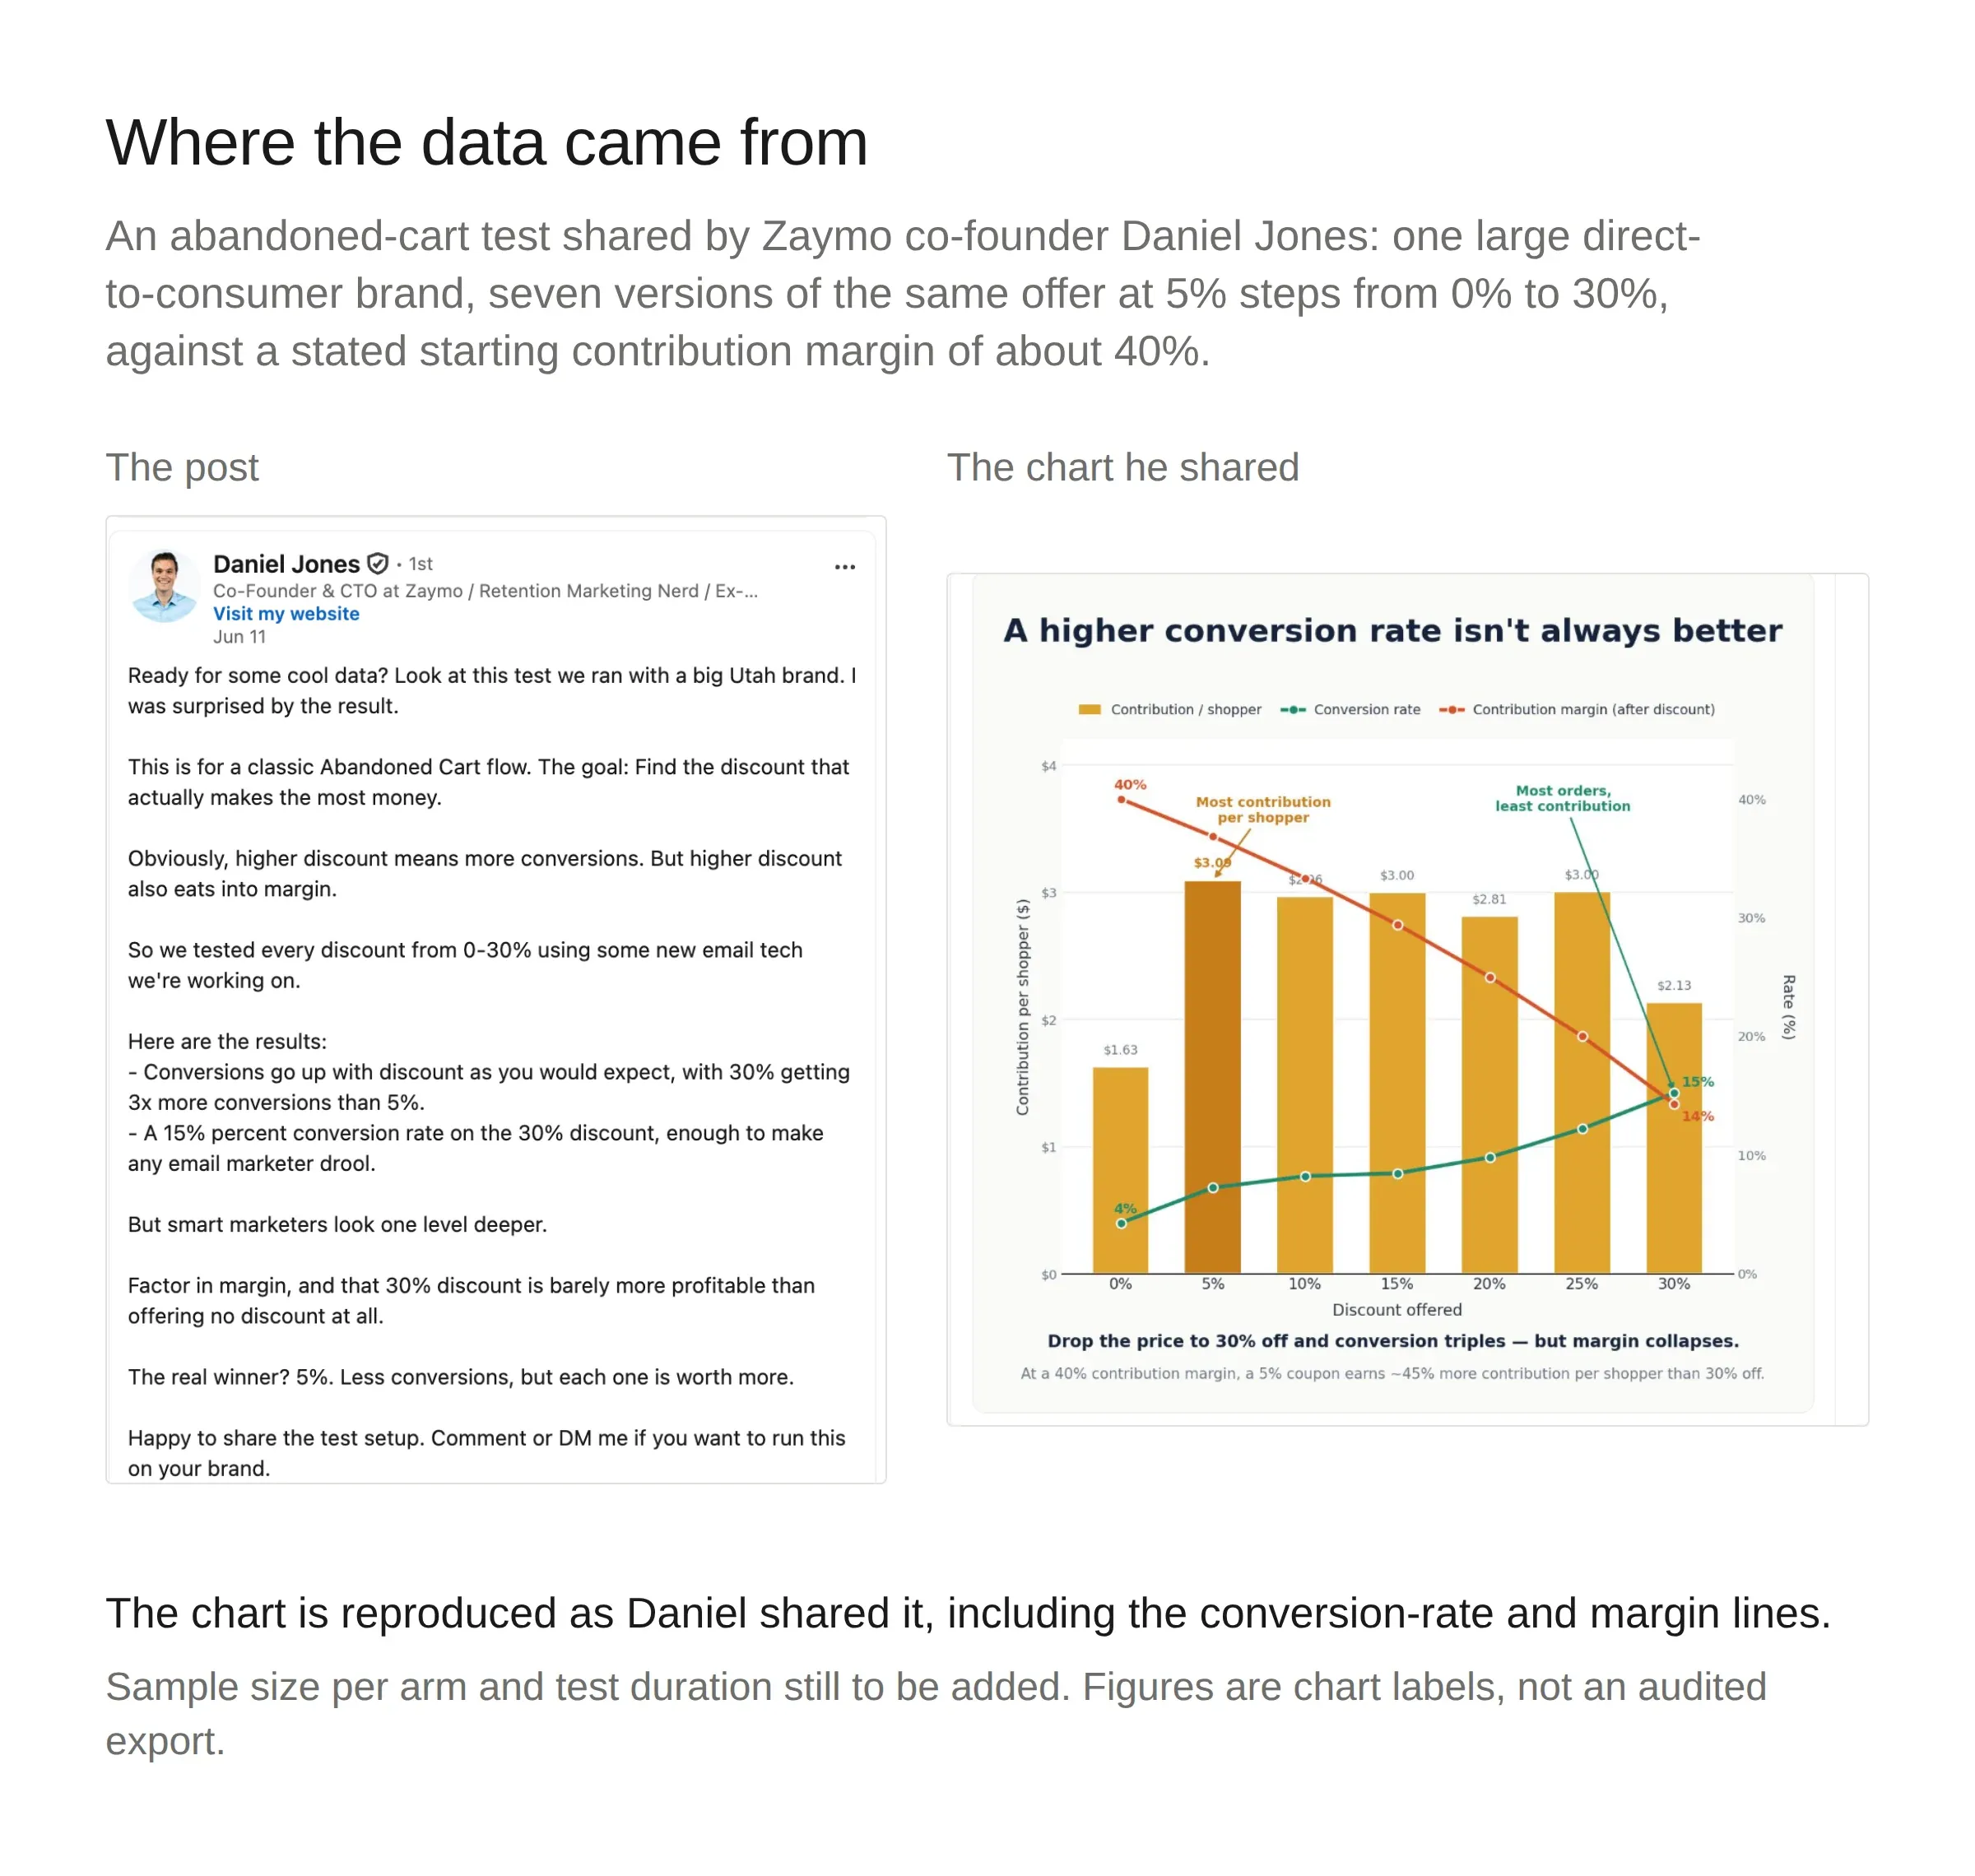
The measure that matters here is contribution per shopper: the margin the brand kept, spread across every shopper who entered the flow, buyers and non-buyers alike.
| Discount | Contribution per shopper |
|---|---|
| 0% | ~$1.63 |
| 5% | ~$3.09 |
| 10% | ~$2.96 |
| 15% | ~$3.00 |
| 20% | ~$2.81 |
| 25% | ~$3.00 |
| 30% | ~$2.13 |
Values are transcribed from the chart Daniel shared, which assumes a starting contribution margin of about 40%.
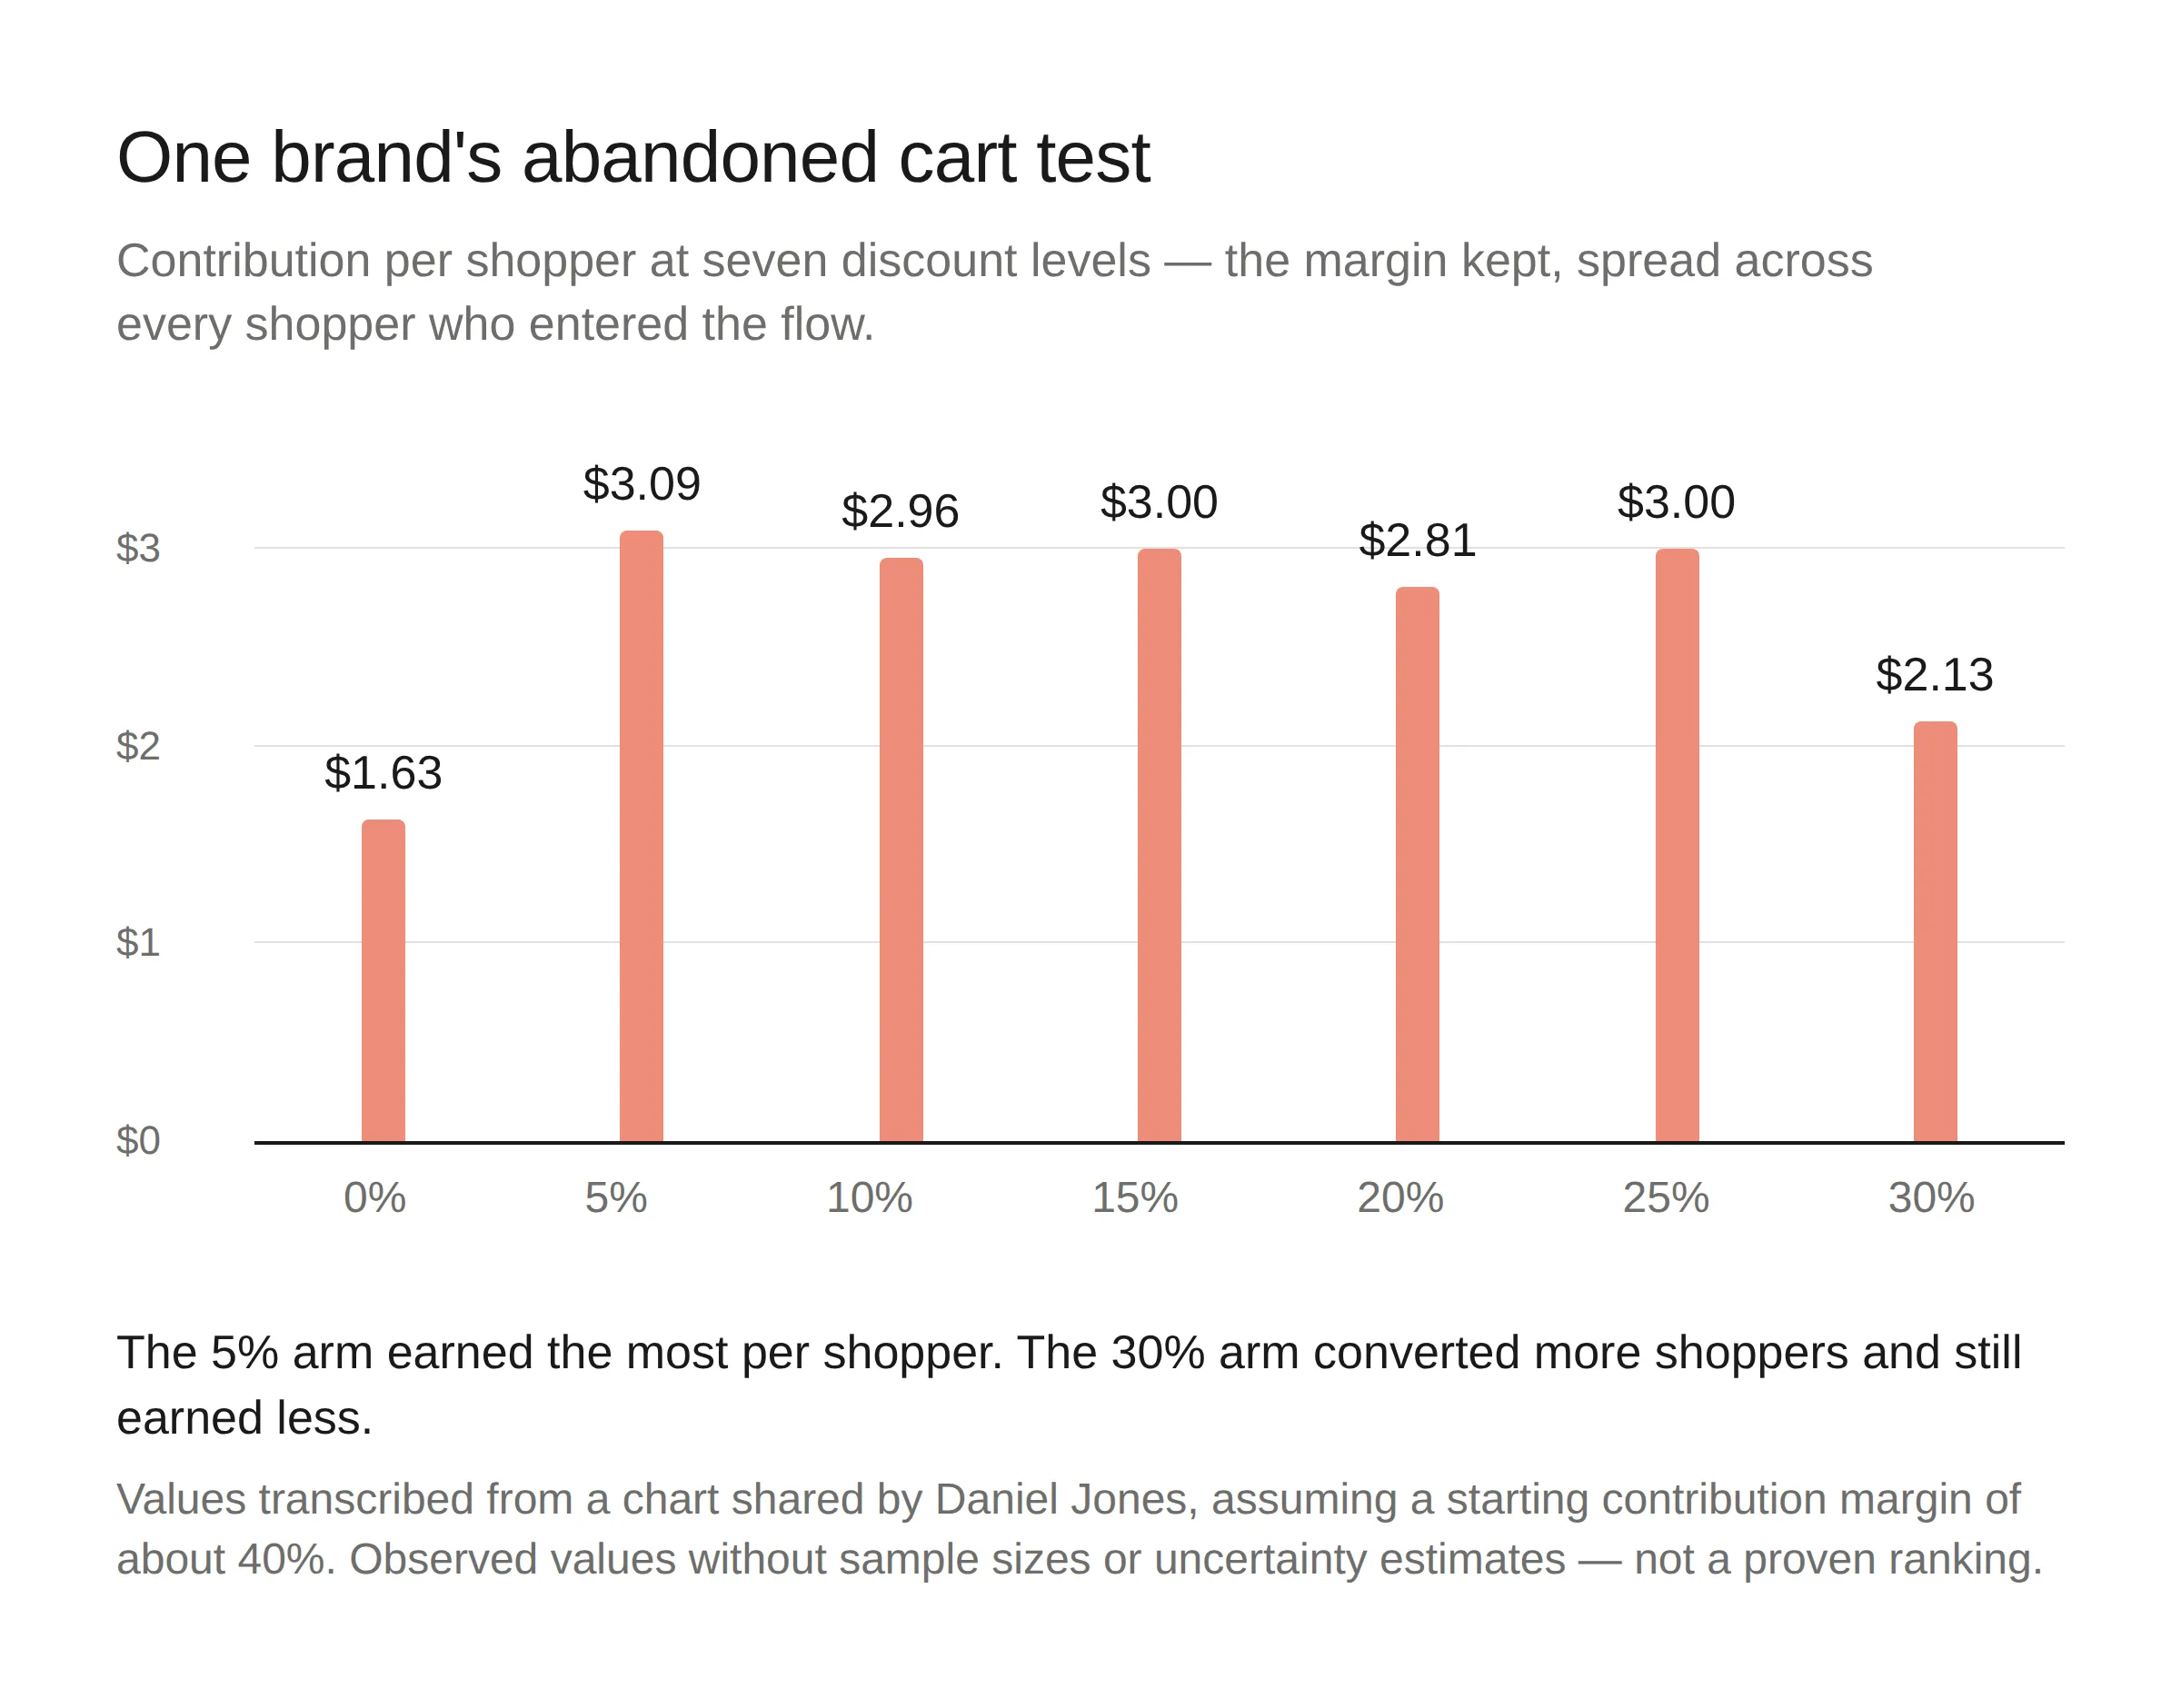
The 5% offer earned the most contribution per shopper ($3.09) and the 30% offer the least of the discounted arms ($2.13).. about 45% more at 5%, or $0.96 per shopper. The 30% arm converted more shoppers; it still earned less per shopper.
Across the 5% to 25% arms, contributions clustered between $2.81 and $3.09.. 5% had the highest contributions, with 15% and 25% about nine cents behind. The 0% arm ($1.63) and the 30% arm ($2.13) sat well below that cluster. These are observed values, without sample sizes or uncertainty estimates, so they aren’t a proven ranking; but the shape is useful: the smaller discounts held their contribution, and the largest gave much of it back.
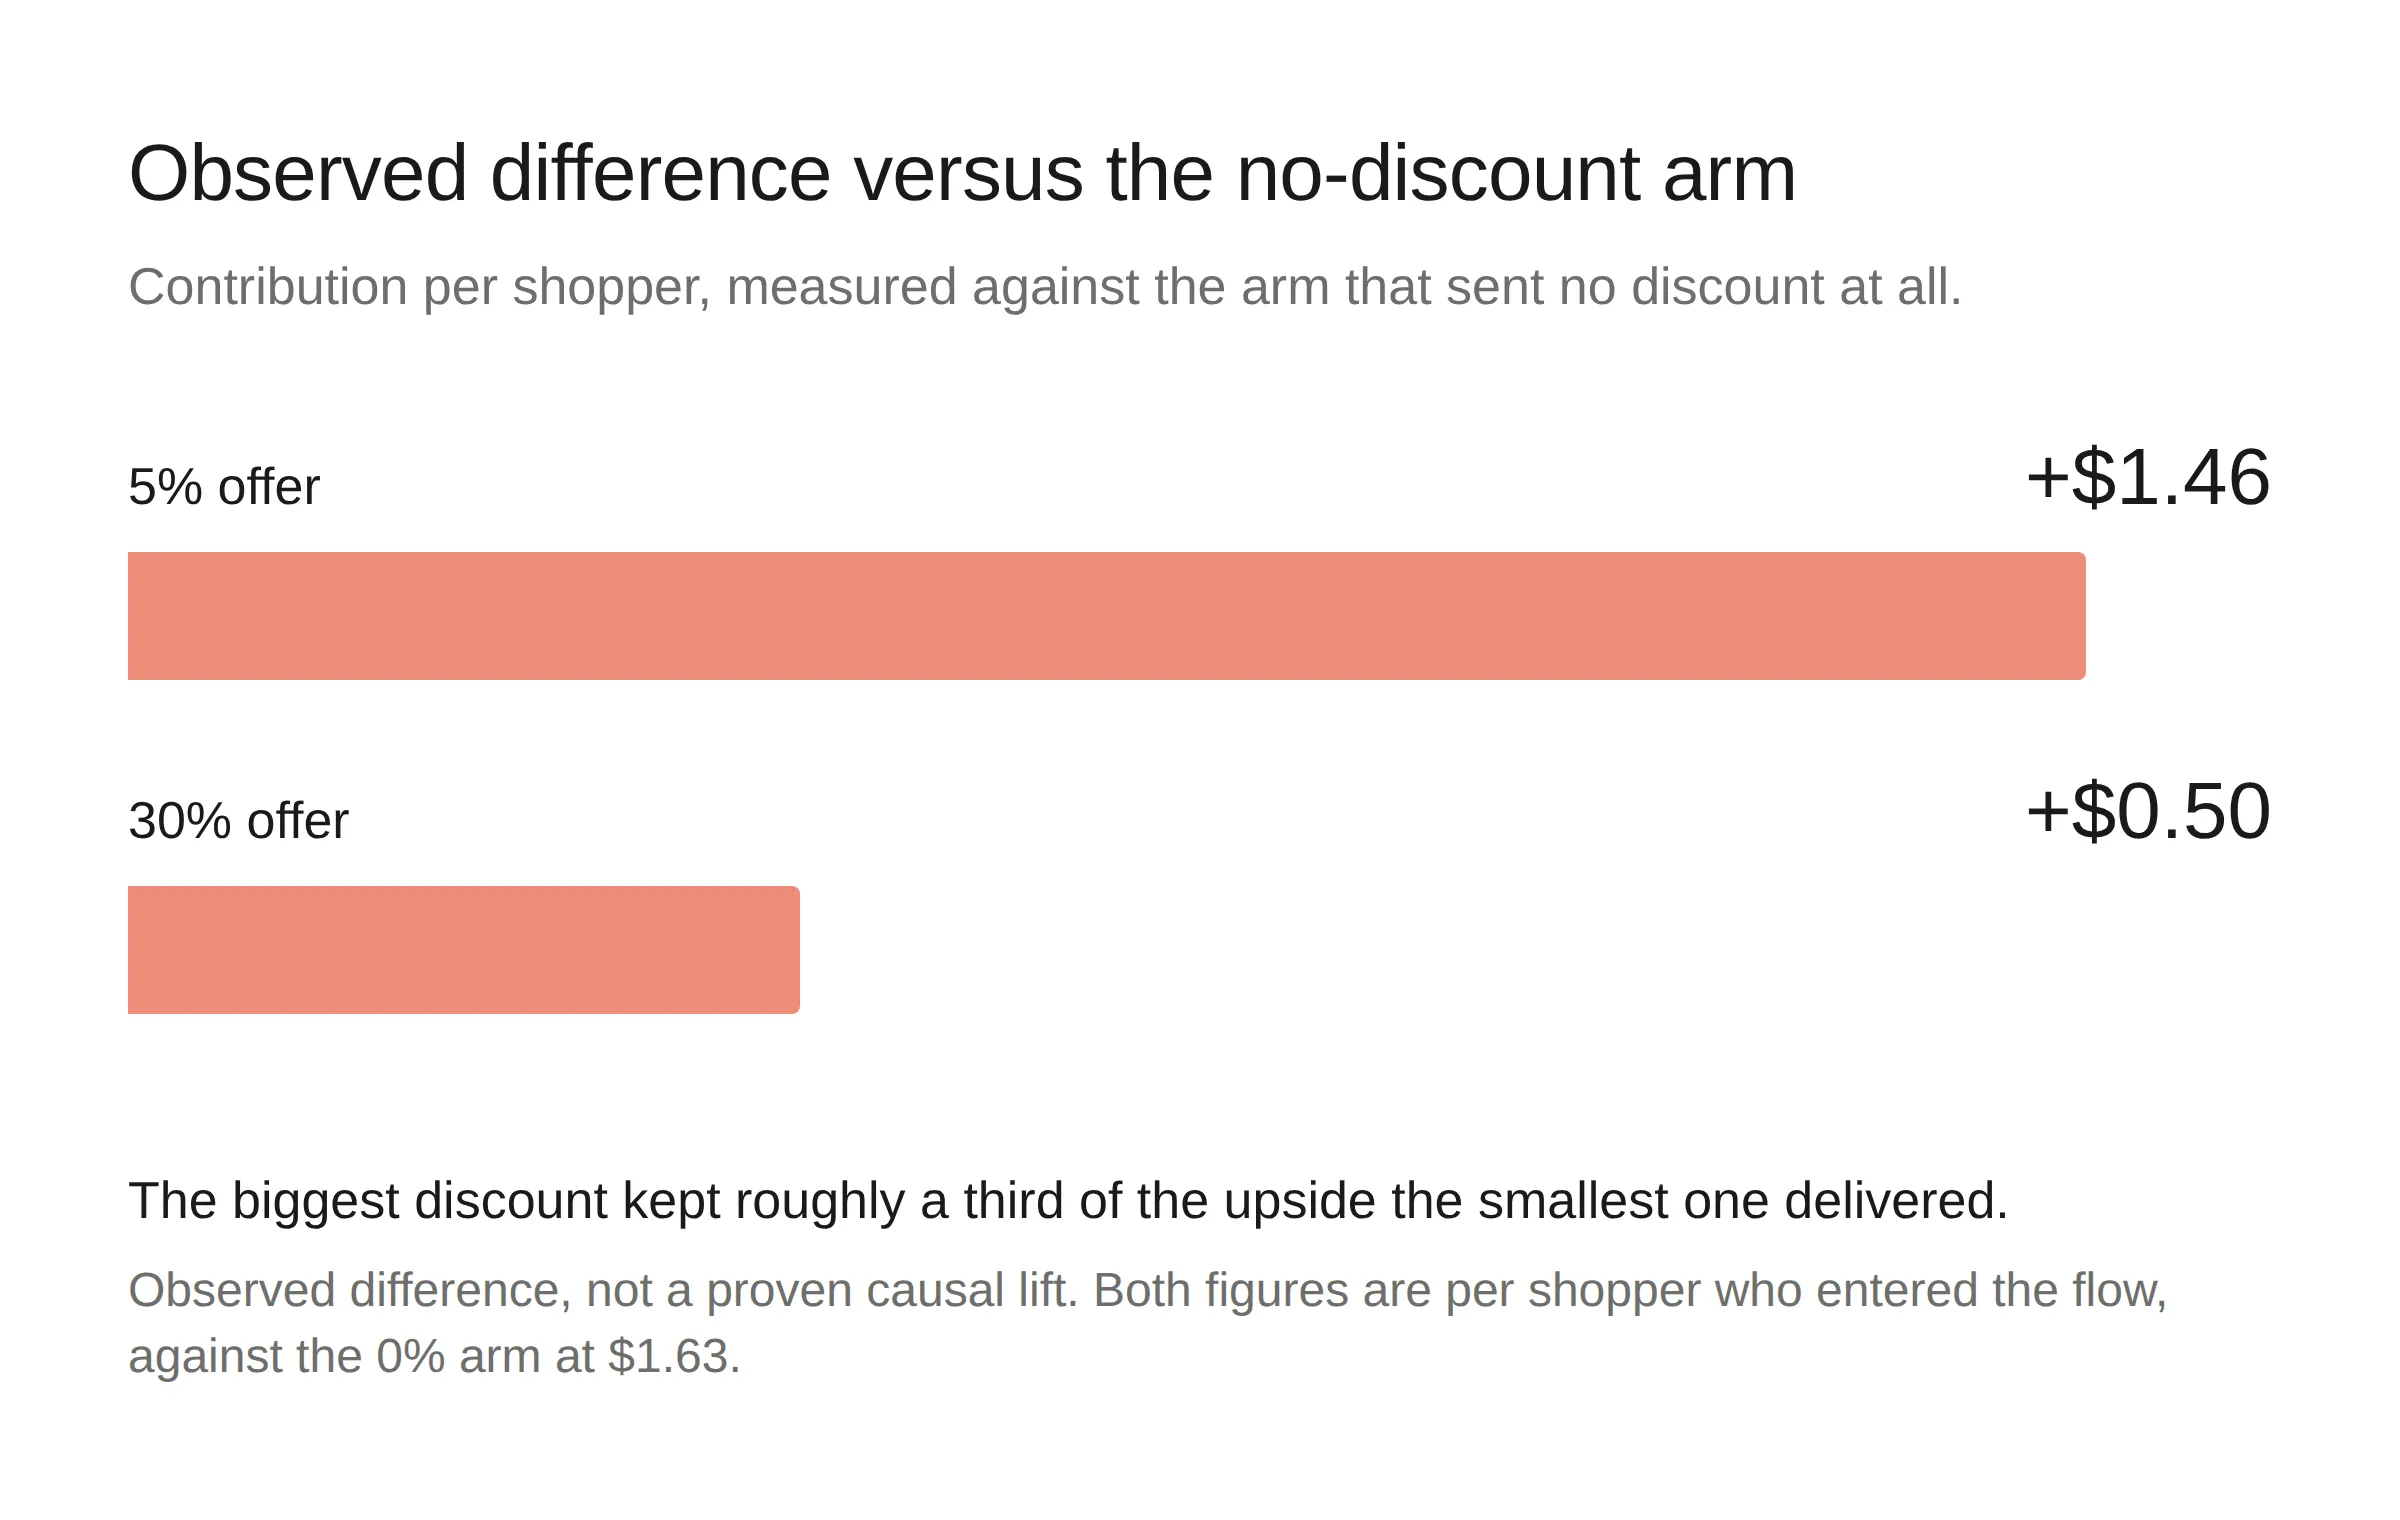
Compared with sending no discount at all, the 5% offer added about $1.46 per shopper and the 30% offer about $0.50… the biggest discount kept roughly a third of the upside the smallest one delivered.
Why conversion rate isn’t enough
A discount doesn’t only go to the shoppers it persuades. It goes to everyone who buys.
A bigger discount wins some additional buyers. But it also goes to everyone who would have bought with a smaller discount, or none, and that margin comes straight off the top. Conversion rate counts the extra buyers and ignores what the discount cost on everyone else.
Up to a point, the extra buyers cover that cost; past it, they don’t. In this test, contribution stayed in a narrow range from 5% to 25% and was lowest among the discounted arms at 30%.
That’s why conversion rate is the wrong way to choose an offer. It counts buyers and ignores what each buyer cost you. Conversion rate is also the kind of metric default reports make easy to optimize.
How to calculate contribution per shopper
The better number is contribution per shopper:
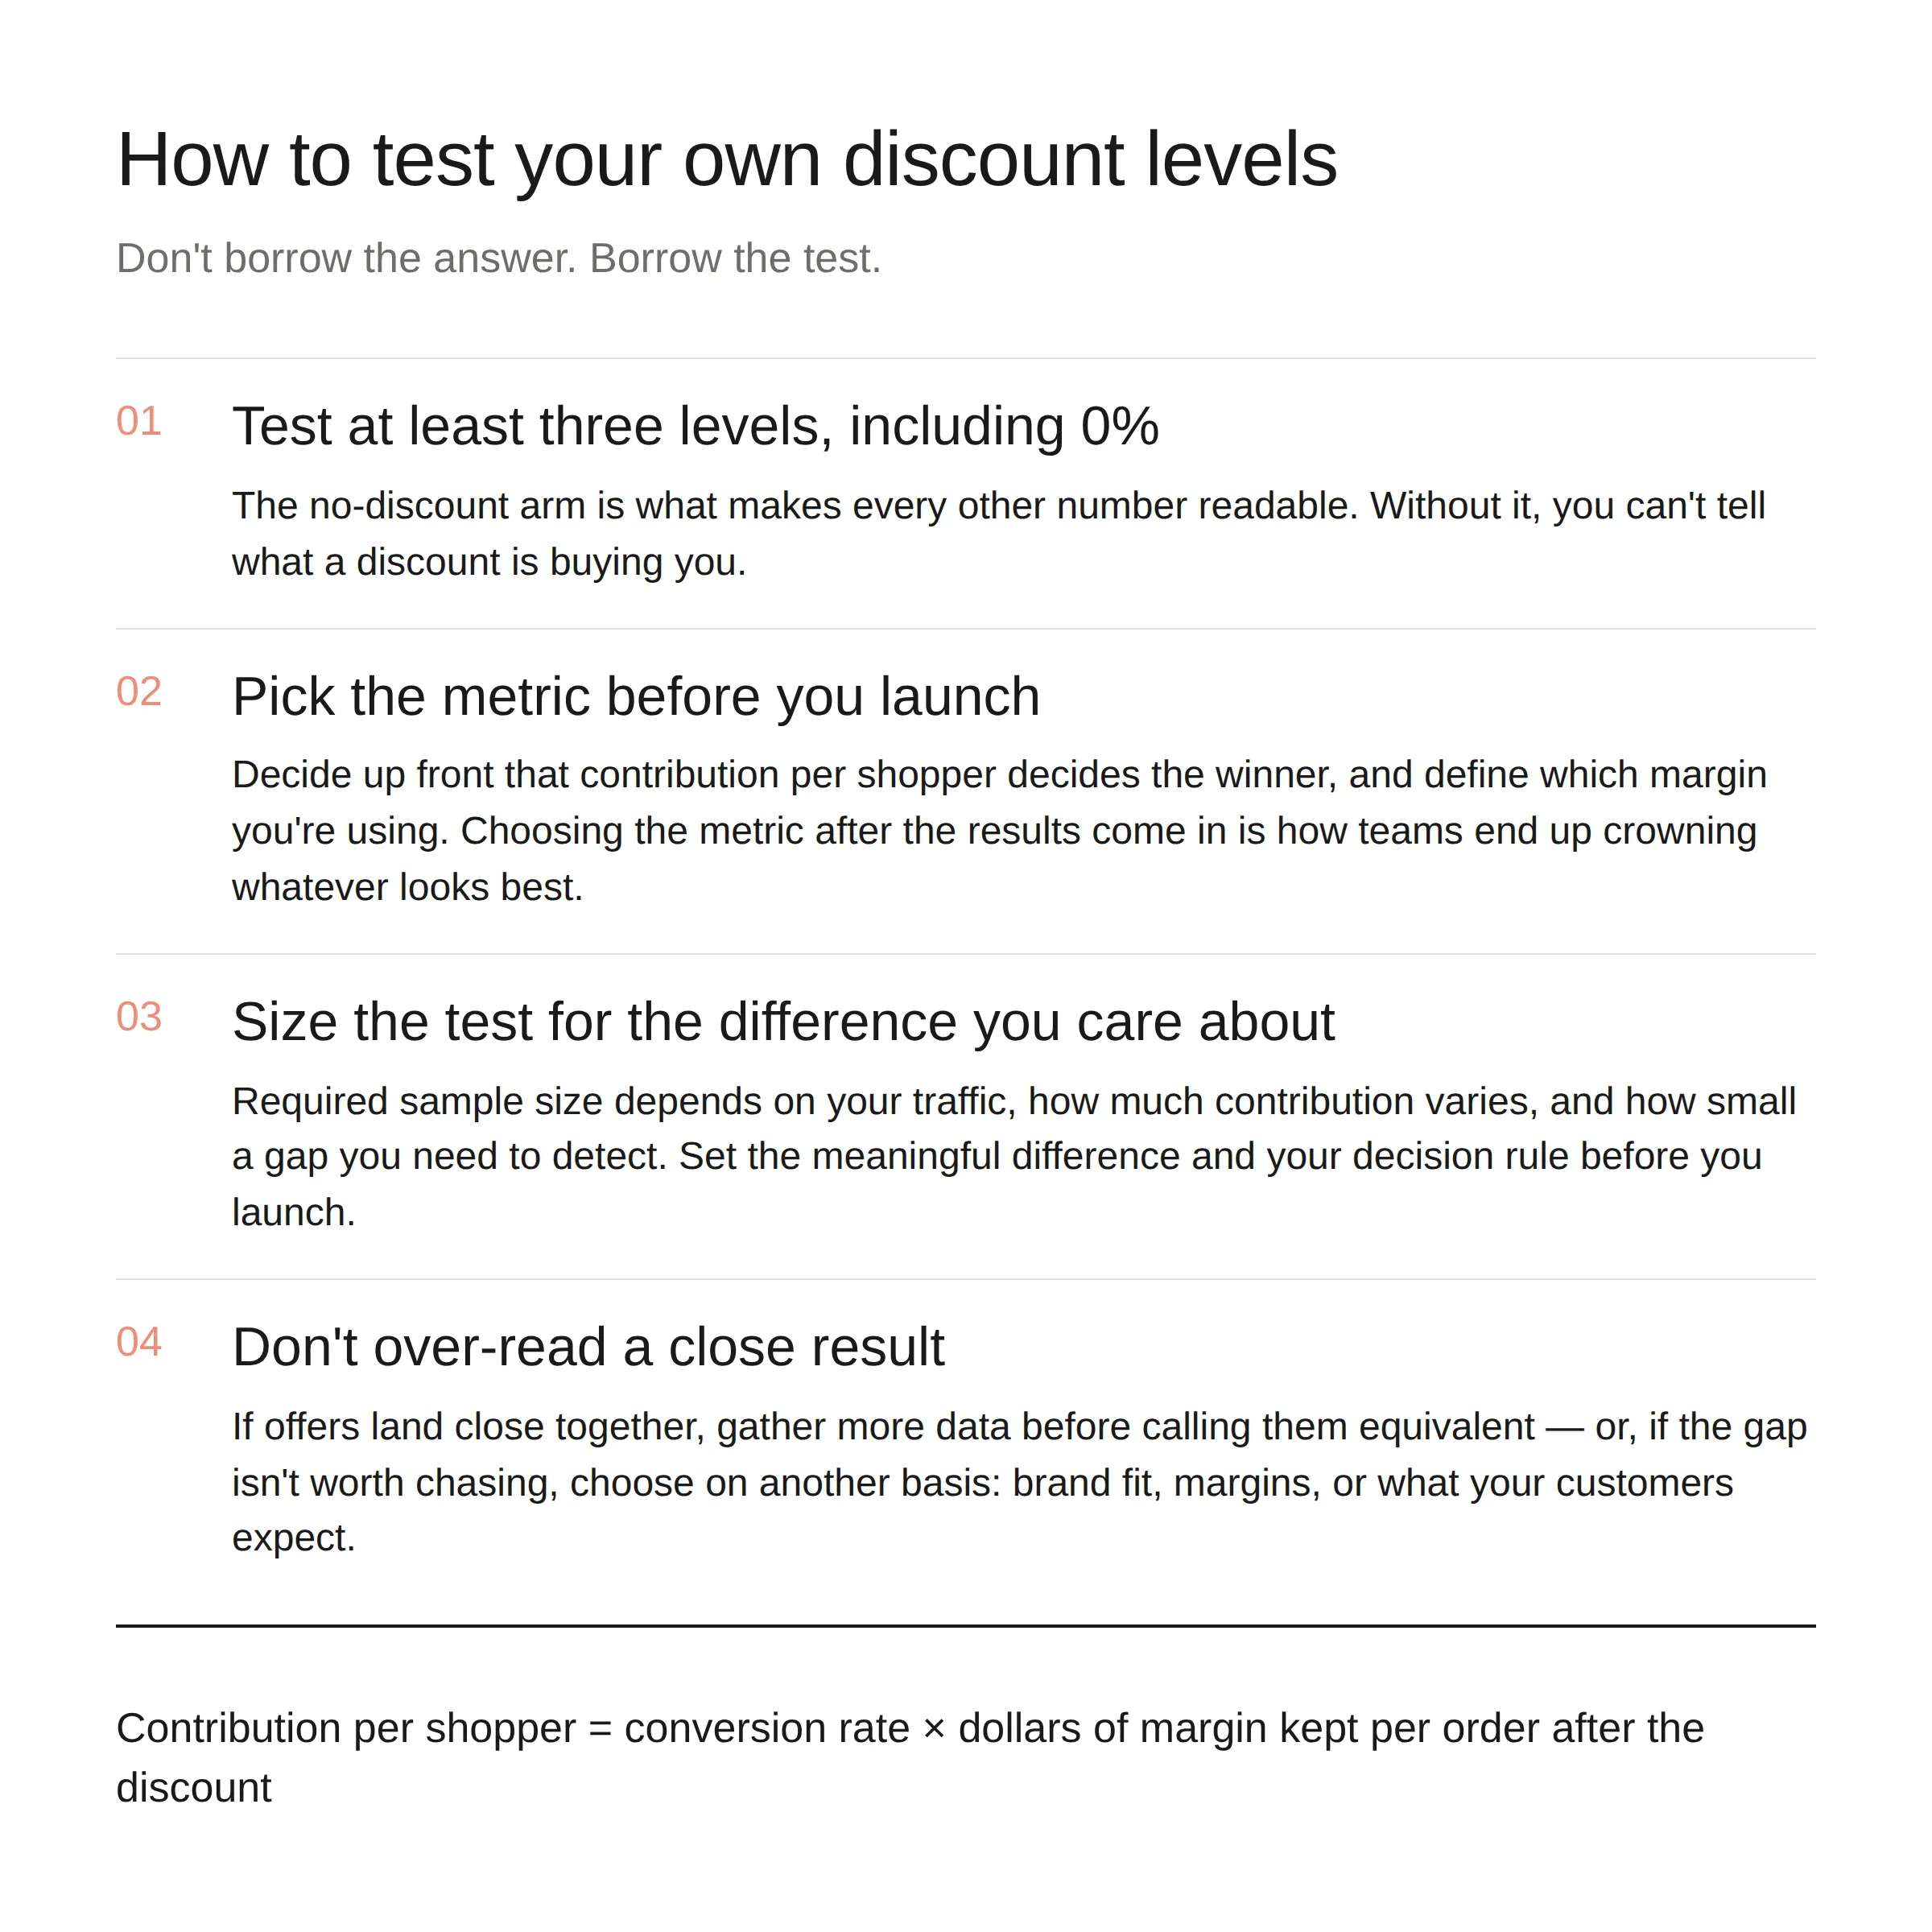
Contribution per shopper = conversion rate × dollars of margin kept per order after the discount
Spread the margin you keep across every shopper who entered the flow, not just the ones who bought. That rewards an offer for winning buyers and charges it for the margin it gives away, in the same number. And because the denominator is every shopper, it can’t be gamed by an offer that converts a small, easy group. (“Margin kept” is dollars, not a margin percentage; if shoppers place repeat orders, use total contribution per shopper rather than a single-order figure.)
Conversion rate survives as the default because it’s the easiest number to find. Most reports put it front and center, which makes it the number most teams optimize; whether or not it’s the one that pays.
How to test your own discount levels
This brand’s results won’t be yours every time. Margins, price points, and customer habits all move the curve, and aggregate findings hide brand-level variation. So don’t borrow the answer, borrow the test.
Why product segments may differ
A brand-wide average can hide differences between products and cart sizes. Zaymo co-founder Brice Douglas has described a subscription brand whose best offer wasn’t the same across its catalog. And, in a separate test, he found that the discount maximizing revenue wasn’t the one maximizing gross profit.
We learn two vital things from this:
First, the metric you optimize can pick a different winner: the offer that drives the most sales isn’t always the one that keeps the most margin.
Second, once you have a reliable overall result, test whether the same offer holds across your important segments… a single coupon can give away too much margin in one segment and too little incentive in another. Validate segment-specific choices on fresh data before treating them as better.
The same measurement principle is worth testing in your retention flows. Compare options like delaying an order, swapping a product, or a smaller discount, and measure contribution over a consistent follow-up window. These abandoned-cart results don’t tell you which retention offer wins; they tell you how to judge it.
Find out what your flows are actually earning per subscriber.